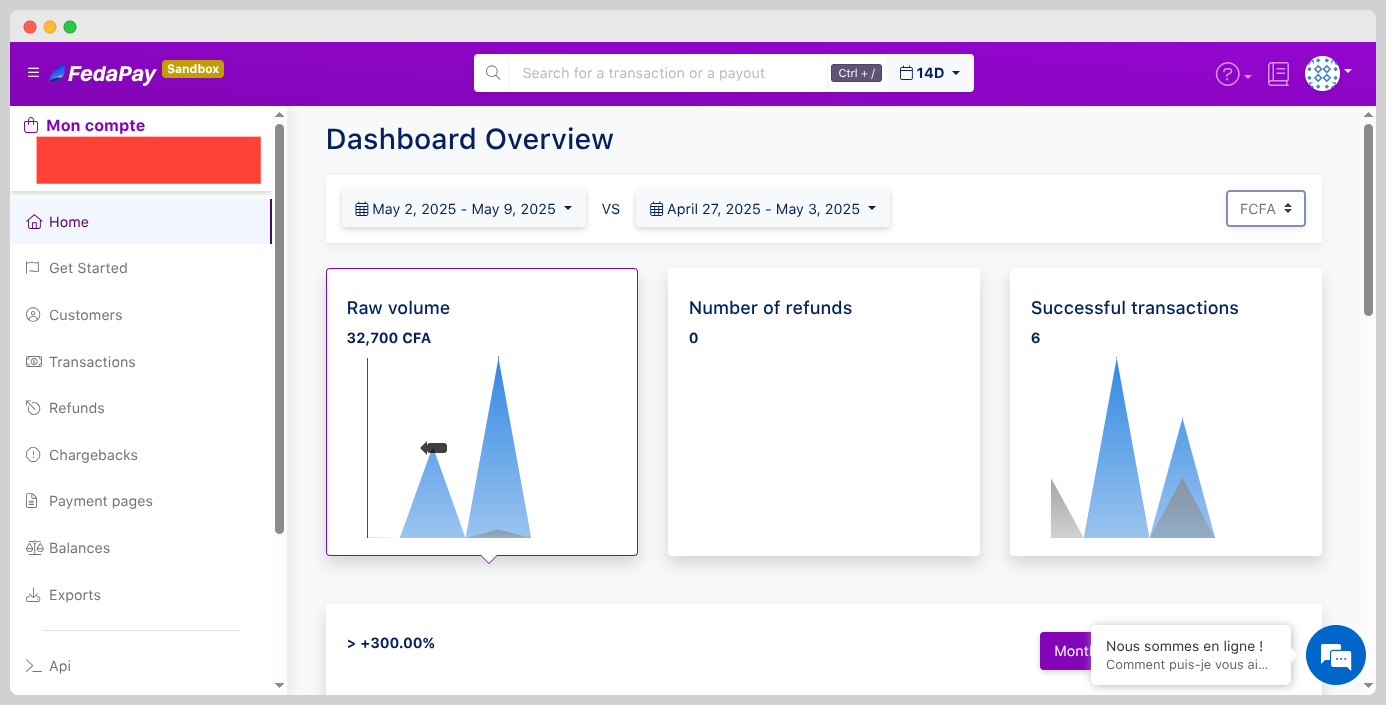
Key Statistics
At the top of the page, you’ll find three main indicators that summarize your recent activity:- Gross Collects Volume: Displays the total amount collected over the selected period.
- Number of Refunds: Indicates the total number of refunds processed during the period.
- Successful Collects: Shows the volume of successfully completed transactions.
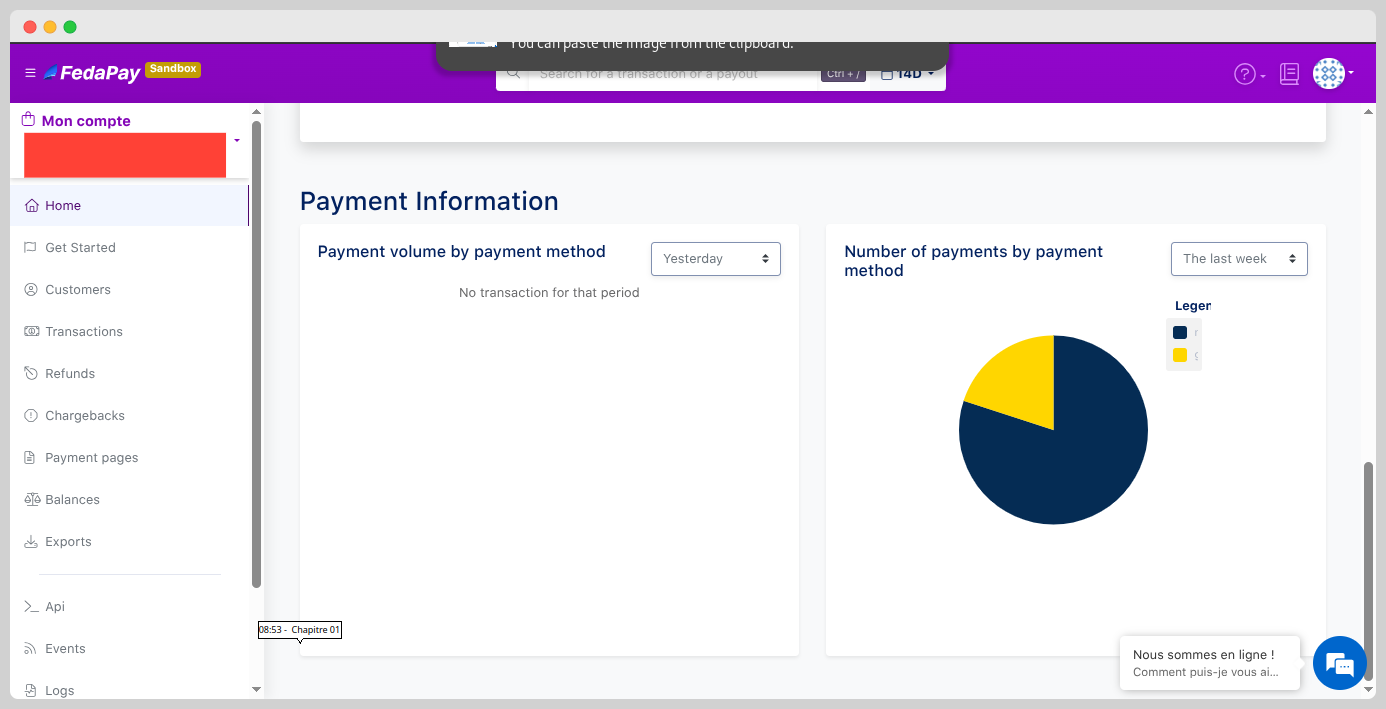
Payment Information
Further down, the interface provides a detailed analysis of your payments, broken down by payment method (bank card, mobile money, etc.). You have access to:- Volume by Payment Method: Compare the amounts collected through each method. Ideal for identifying top-performing channels.
- Number of Payments by Method: View how often each payment method is used.
Note
- The Dashboard is your daily control hub.
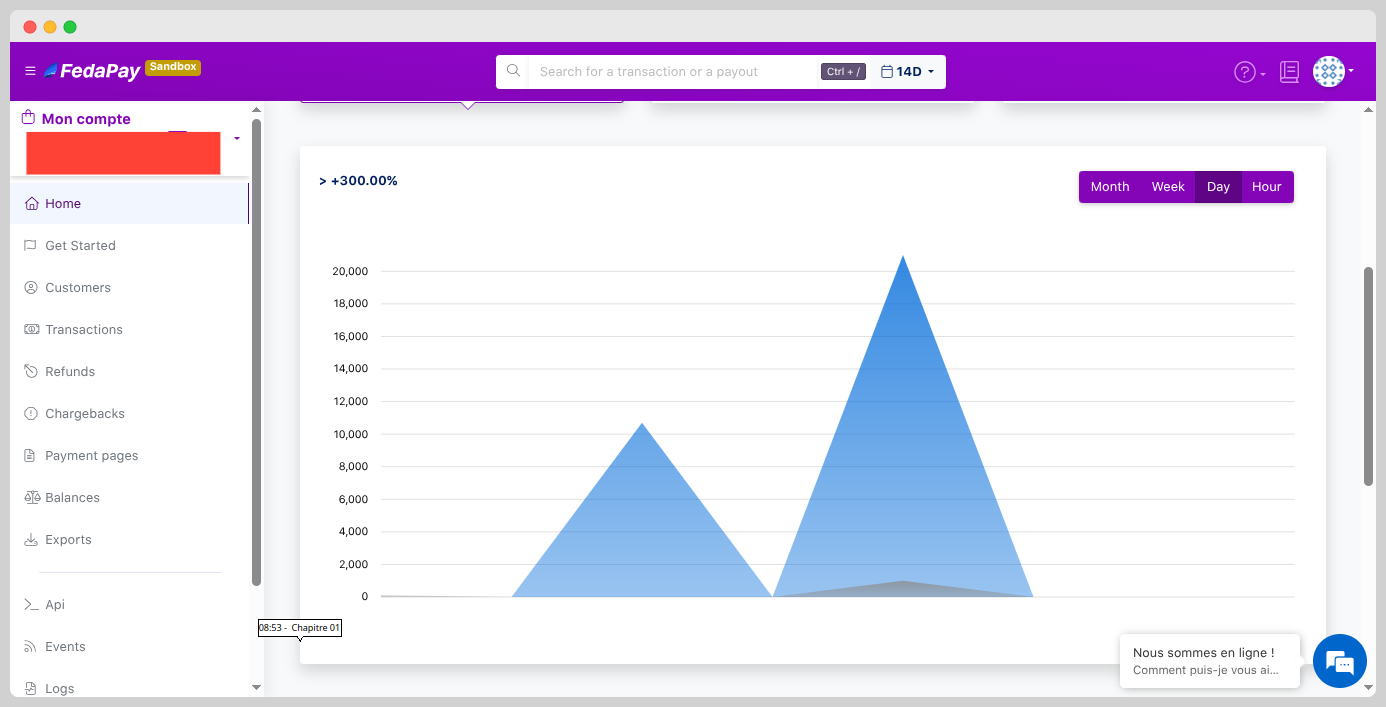
- Data is updated in real-time.
- Dynamic filters allow for quick period-based analysis.
- All sections include graphical representations for better readability.